Engineering Diagrams
About
I frequently collaborate with writers, editors, and engineers to create diagrams for Datadog Docs and Datadog’s blog articles. The challenge lies in simplifying and visualizing abstract concepts in a way that’s both digestible and precise, ensuring clarity without compromising accuracy.
Thoughtful application of color and visual hierarchy often plays a crucial role in achieving this balance, transforming complex ideas into clear, impactful visuals.
Year
2022–ongoing
Tools used
Adobe Illustrator
2022–ongoing
Tools used
Adobe Illustrator
︎︎︎︎︎︎
Burn Rate Is a Better Error Rate
By: James FrulloPublished: September 4, 2024
As we’ve seen, there are two ways to interpret an error budget: as a quantity (number of requests, number of minutes, etc.) or as a percentage (allowed or ideal error rate). For our example web store, our error budget is 1 percent according to the percentage interpretation but 700 requests according to the quantity interpretation.
Which interpretation is right? You might expect us to say that there’s value in both interpretations. But the quantity interpretation is less useful for one important reason—SLOs are typically calculated over rolling window time frames.

Note that since burn rate is the ratio of two error rates, it’s a unitless number. A burn rate value of one indicates you are on pace to exactly burn through your error budget. Any rate above one means that you’ll exceed your budget if you sustain that rate. For example, a sustained rate of two will mean you’ll exceed your budget in half of the SLO time frame.
This is how the Google book visualizes burn rate:
This is how the Google book visualizes burn rate:

________________________________________________________
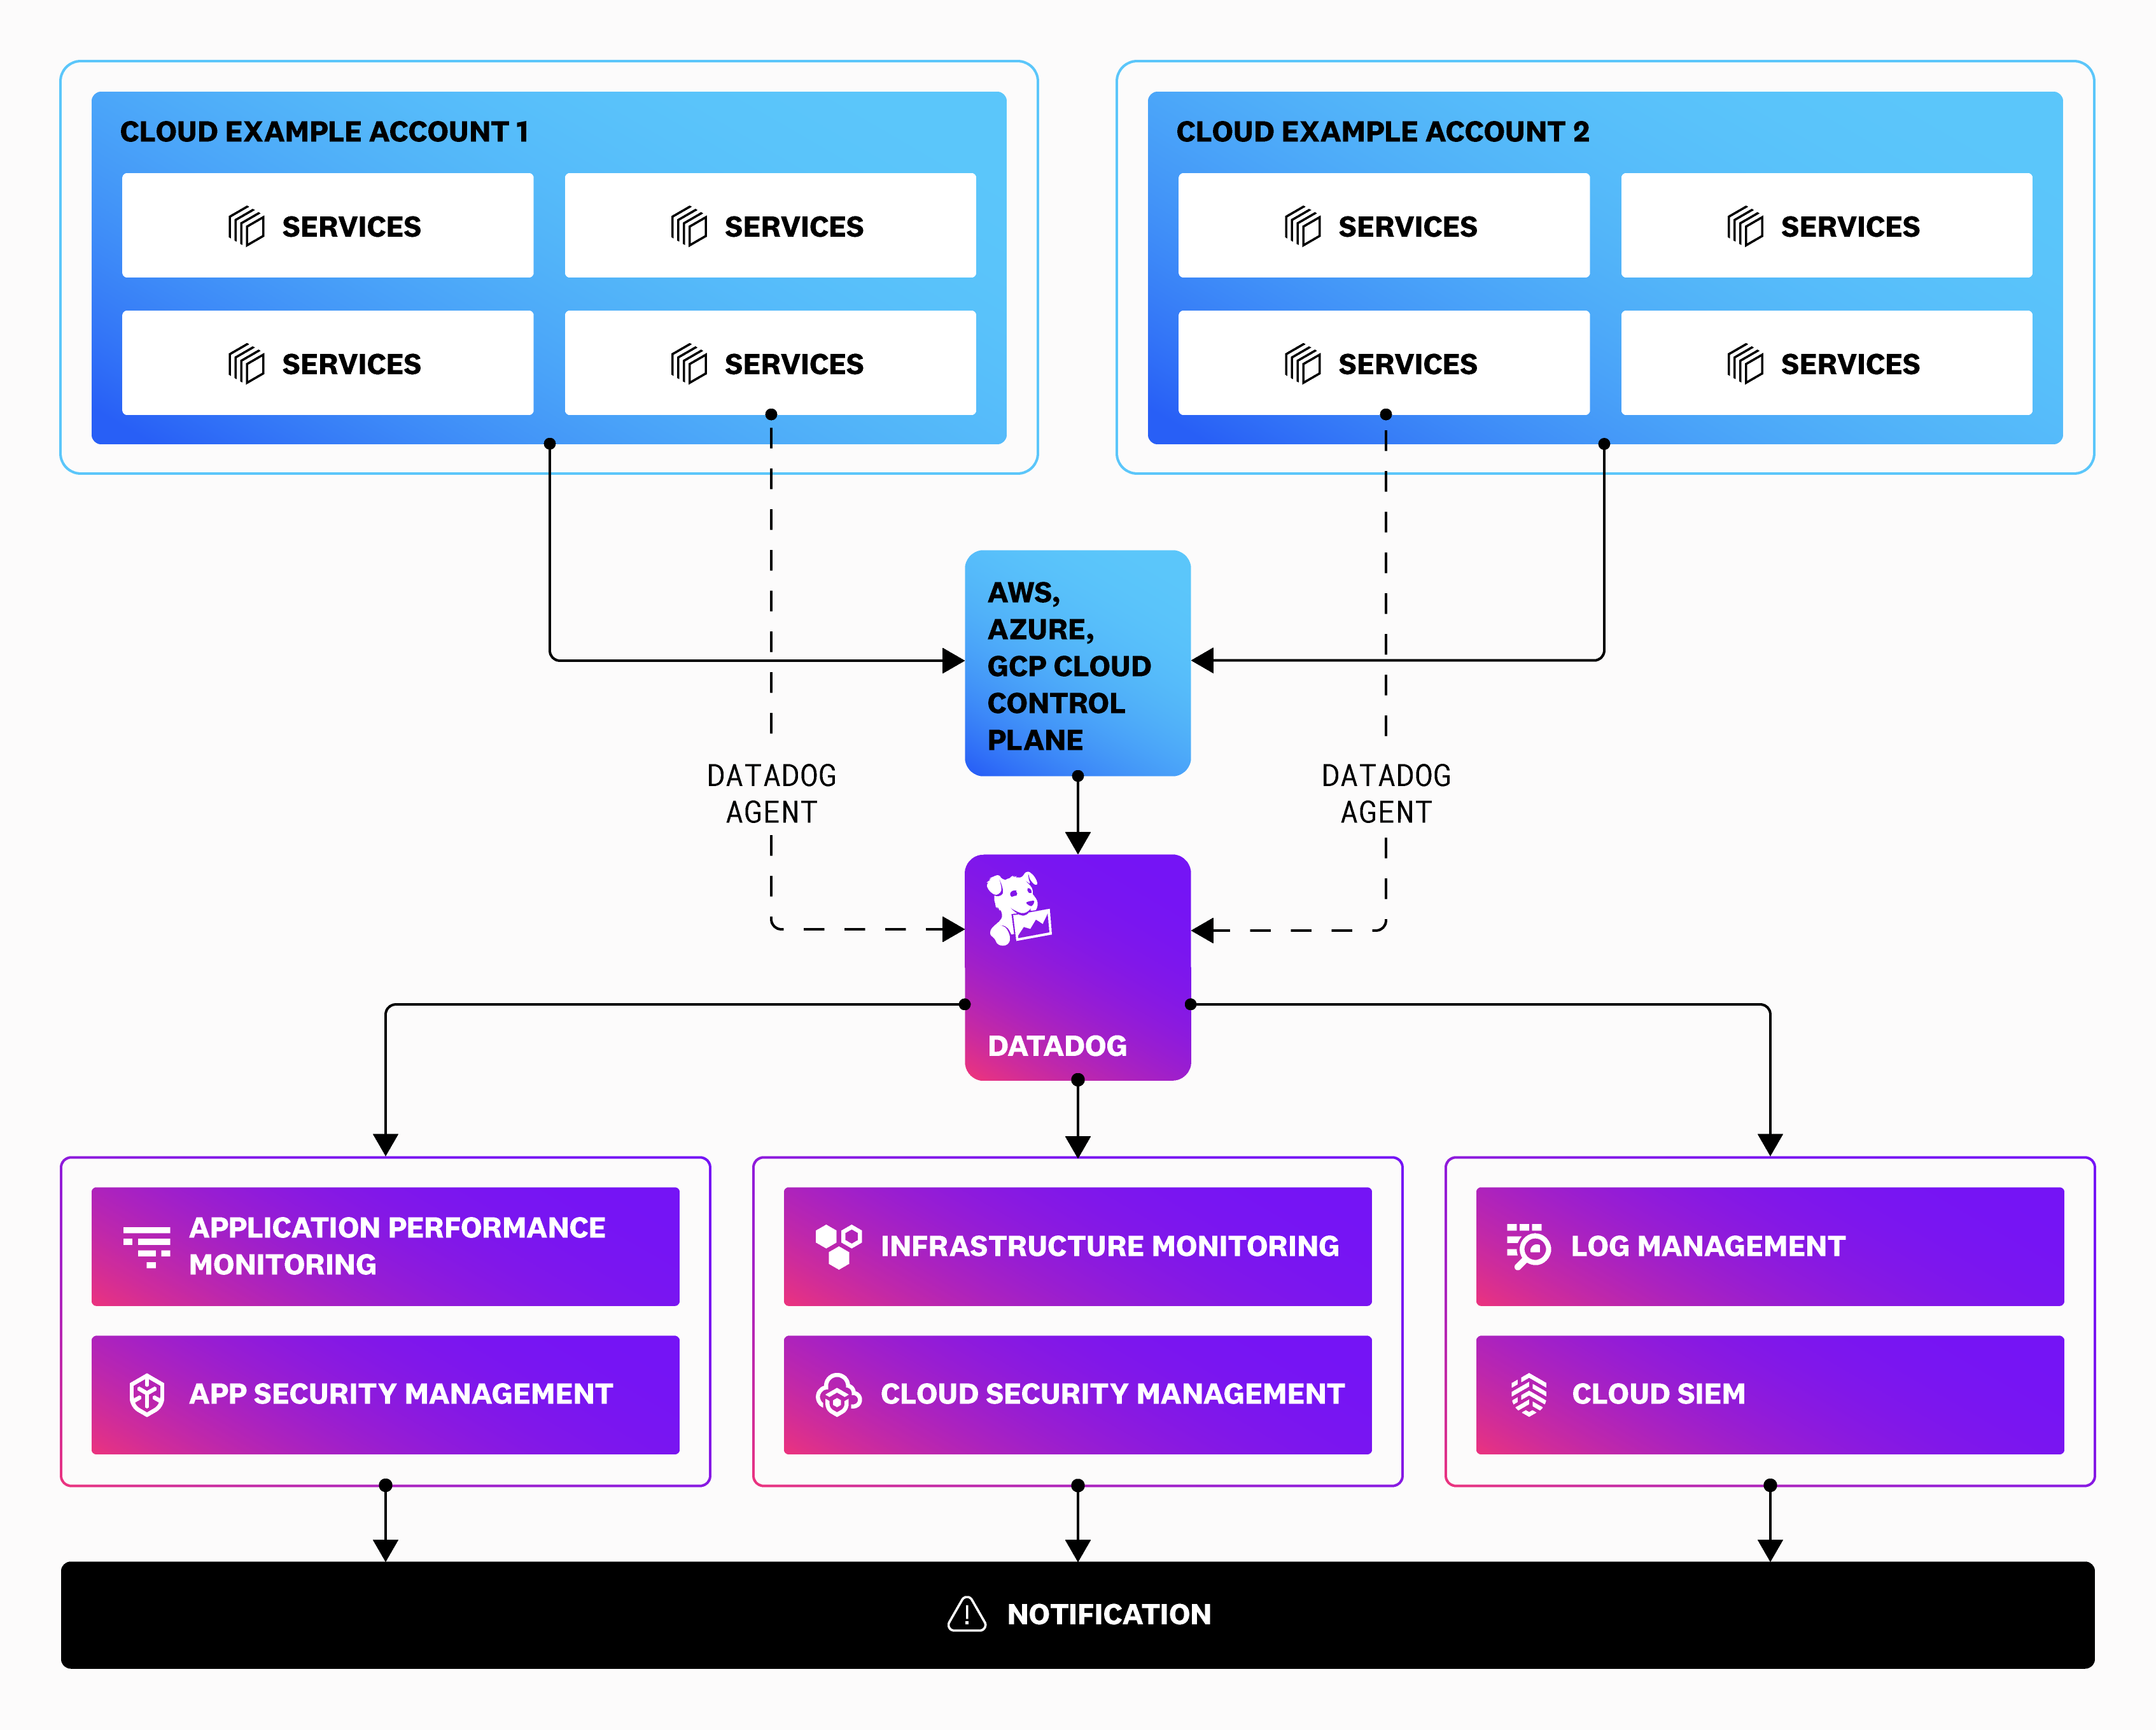
AWS Fargate Configuration Guide for Datadog Security
Published: September 18, 2024
AWS Fargate Configuration Guide for Datadog Security
Published: September 18, 2024
________________________________________________________________________________________________________________
Best Practices for Monitoring and Remediating Connection Churn
By: Nicholas Thomson & Guy Arbitman
Published: September 18, 2024
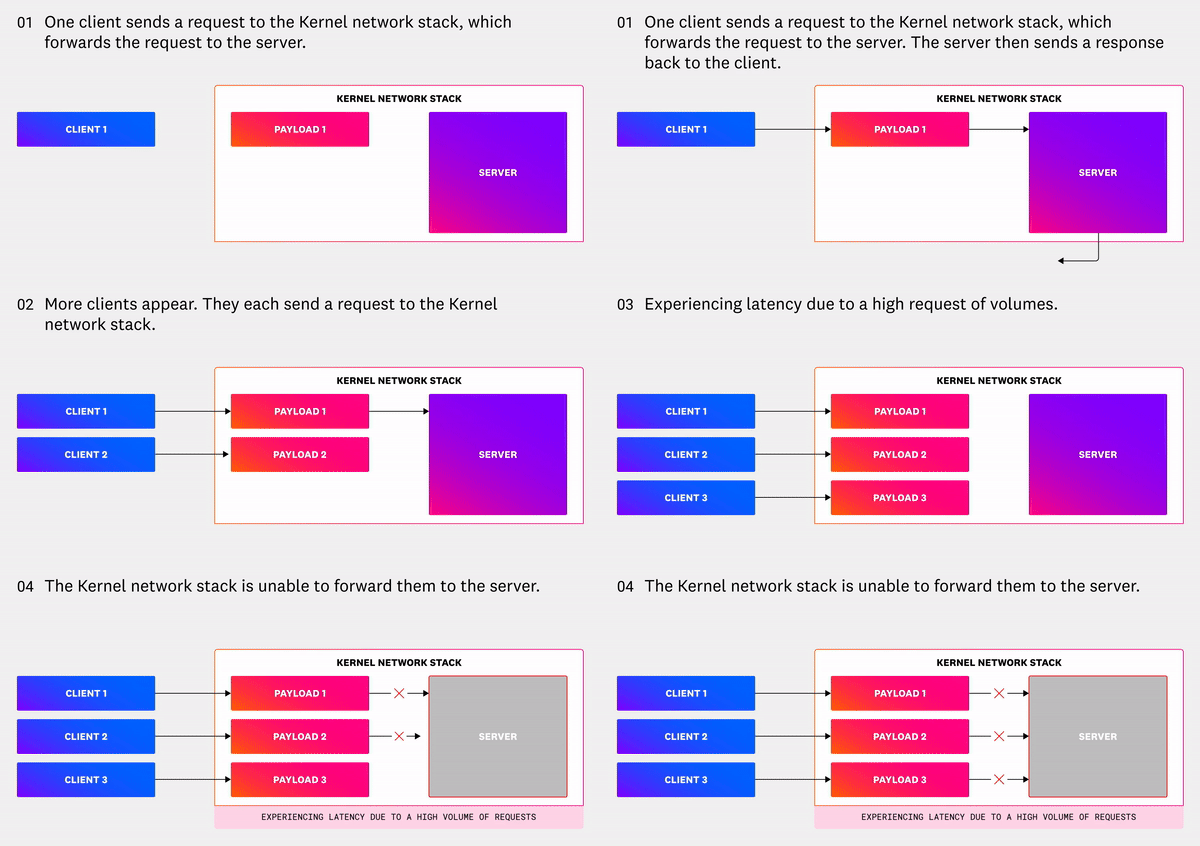
Request bottlenecksConnection churn can lead to request bottlenecks in a system due to the overhead associated with repeatedly creating and closing network connections. Request bottlenecks can cause the system to become slow at handling additional incoming requests, reducing the overall request processing capacity. This can have a cascading impact—for example, it may cause downstream services to experience latency or even failure due to the upstream service experiencing the bottleneck.
